

Network research6 min read
Solana: beyond the headline number
Start with the mint, identify the pool, and compare execution and activity over matching observation windows.
Independent thinking starts with better questions
Read decentralized finance through four lenses: liquidity, activity, market context, and risk. Practical guides for Solana, Ethereum, Bitcoin, and the wider crypto market.
Research guides. Clearly labeled examples. No live scores or trading signals.
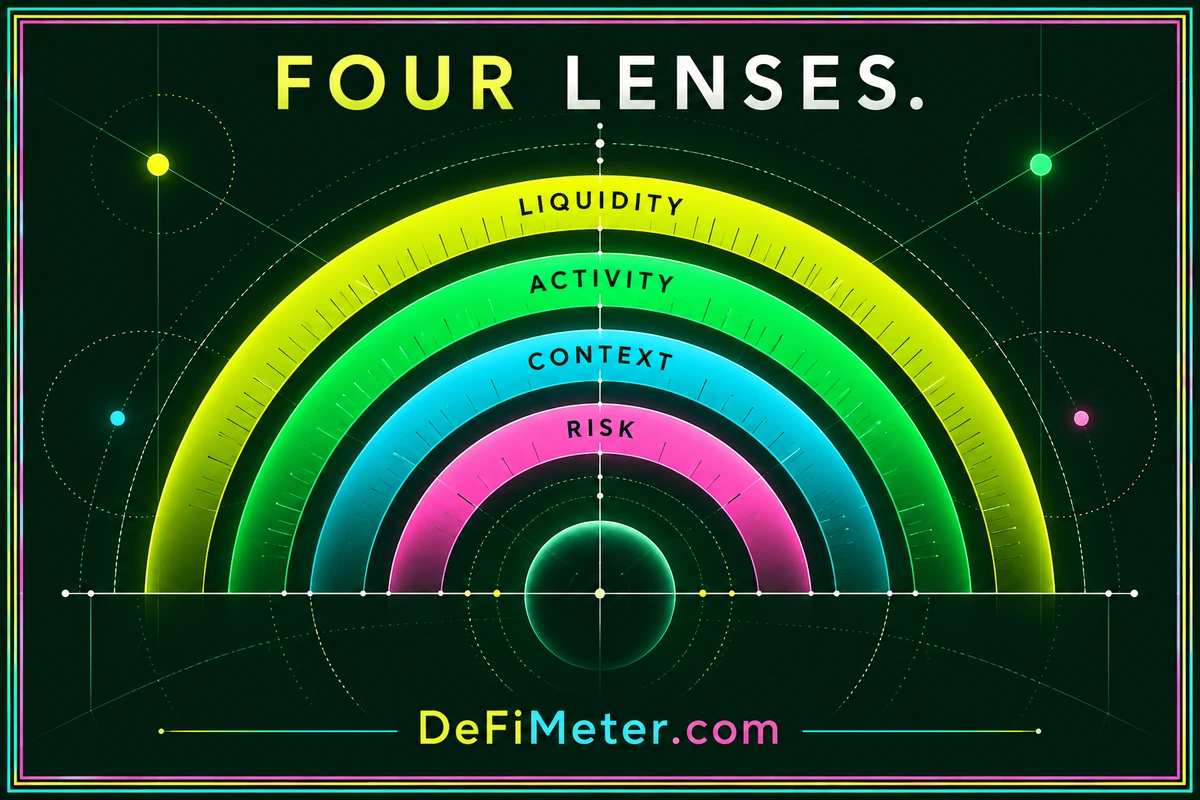
01 / Read the whole picture
A large balance, a busy pool, and a rising price answer different questions. Keep the evidence separate before drawing a conclusion.
Investigate a pool’s execution conditions at a named size, not just its displayed balance.
What could the same order actually receive?
Read volume and fees over matching windows with the source definition attached.
What happened, and over which interval?
Separate price changes, instrument differences, and chart timeframes.
What else could explain the movement?
Map controls, dependencies, and the intended exit. Keep unanswered questions visible.
What has not been established?
A research profile is useful when you can explain every input. An unknown is a question—not a neutral score.
02 / Choose your research path
Start with the network or problem you are studying. Each guide gives the topic its own scope and checklist.
Build an explainable research profile with liquidity, activity, market context, and risk kept separate.
Explore DeFi Meter02Identify the asset and pool before comparing liquidity, activity windows, and execution assumptions.
Explore Solana DeFi Meter03Separate mainnet, layer-two deployments, related claims, and valuation effects in Ethereum research.
Explore Ethereum DeFi Meter04Distinguish native BTC market context from represented assets, backing questions, and exit processes.
Explore Bitcoin DeFi Meter05Map contract identity, change controls, asset dependencies, and documented withdrawal conditions.
Explore Web3 DeFi Meter06Align equity and crypto instruments, trading sessions, observation times, and return definitions.
Explore Stock Charts DeFi Meter07Give trend, momentum, and activity distinct roles without promising signals or future returns.
Explore Technical Analysis DeFi Meter08Combine an asset-level question with comparable observations, a transparent cost model, and clear limits.
Explore Crypto DeFi Meter03 / A worked example
Hold the quantity constant and change only the assumed price. The dollar value rises, but no new units arrive.
Read the TVL, volume & fees guide ↗A valuation change, not evidence of a deposit.
04 / DeFi Meter Lab
Original field notes with worked examples, research checklists, and one primary editorial source per article.
Start with the mint, identify the pool, and compare execution and activity over matching observation windows.
Understand balance-versus-flow measures, price effects, fee allocation, and the limits of annualized figures.
Map the exact interaction, inspect change controls, and keep evidence gaps visible without inventing a safety score.
05 / Before you begin
Know what the site does—and what a research reading cannot tell you.
About DeFiMeter.com ↗On this site, a DeFi meter is an educational research framework. It keeps liquidity, activity, market context, and risk separate so you can explain what each observation supports.
No. DeFiMeter.com is a static research publication. Numerical examples are hypothetical and explicitly labeled. It does not publish live prices, scores, or trading signals.
Choose the matching network guide. Solana research begins with mint and pool identity; Ethereum comparisons need deployment boundaries; Bitcoin-related instruments need a clear description of their connection to BTC.
No. A chart observation does not establish contract controls, asset backing, withdrawal conditions, or execution availability. Keep market context and application dependencies in separate records.
No. All guides are openly readable. The site has no wallet connection, account system, or data-entry forms.
One better question at a time.

